
When screening for the best (there are no perfect ones) opportunities, it does take work. I have had numerous occasions when I have collected all of the necessary information, but no opportunity “won.” Whether this is due to my inexperience or that day’s reality, I realize I am learning each time I do the work.
Well, enough of my soapboxing. Today, we need to find out how the 24h Volume matches up with the 45 day (approximate) Volume.
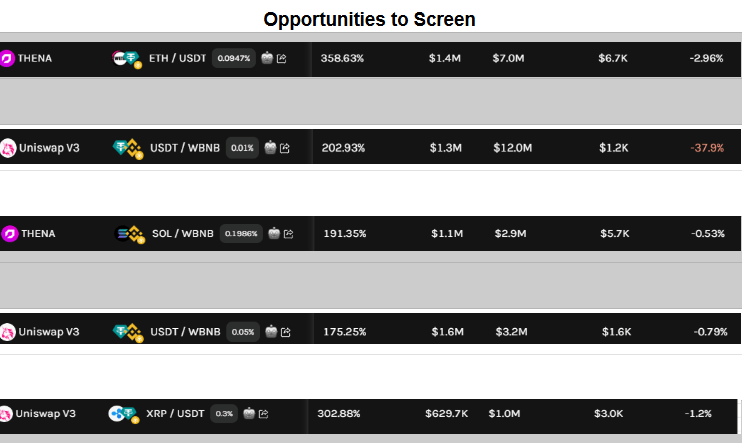
I will provide the steps to find the 45-day average, but I won’t do it on the specific opportunities listed above. After the steps are completed, I will display the results of this exercise.
Right Click on the Opportunity You Want to Look At (This is done in Krystal.)
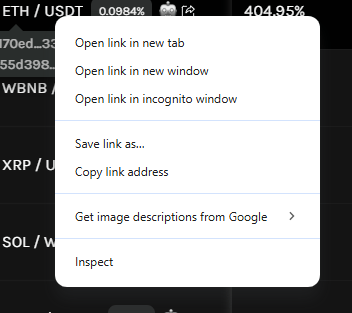
Finding Your Way to Dexscreener
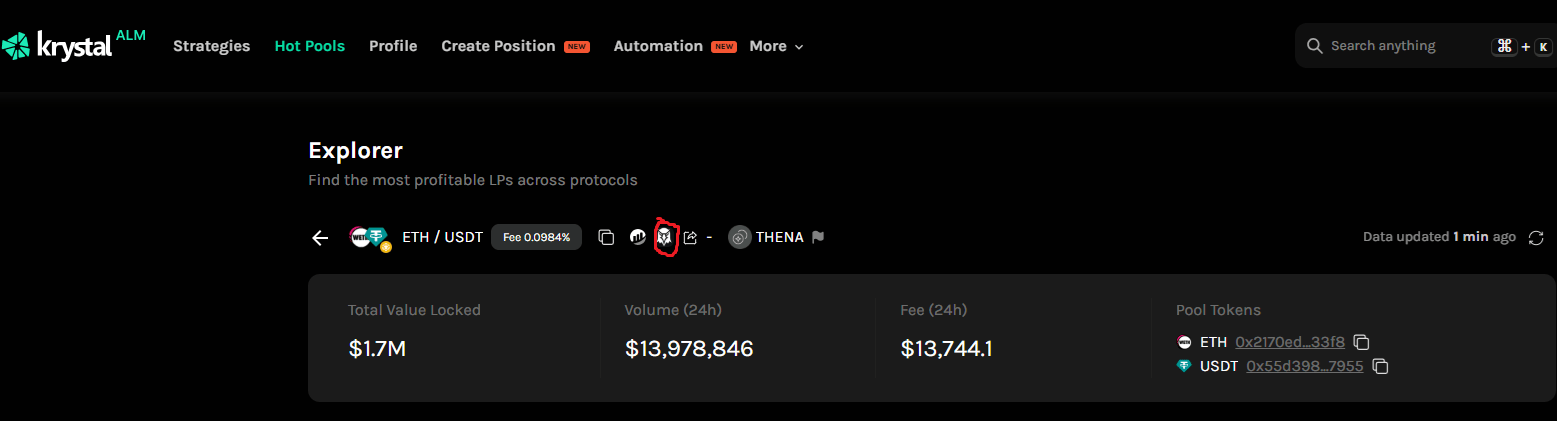
Steps on Dexscreener
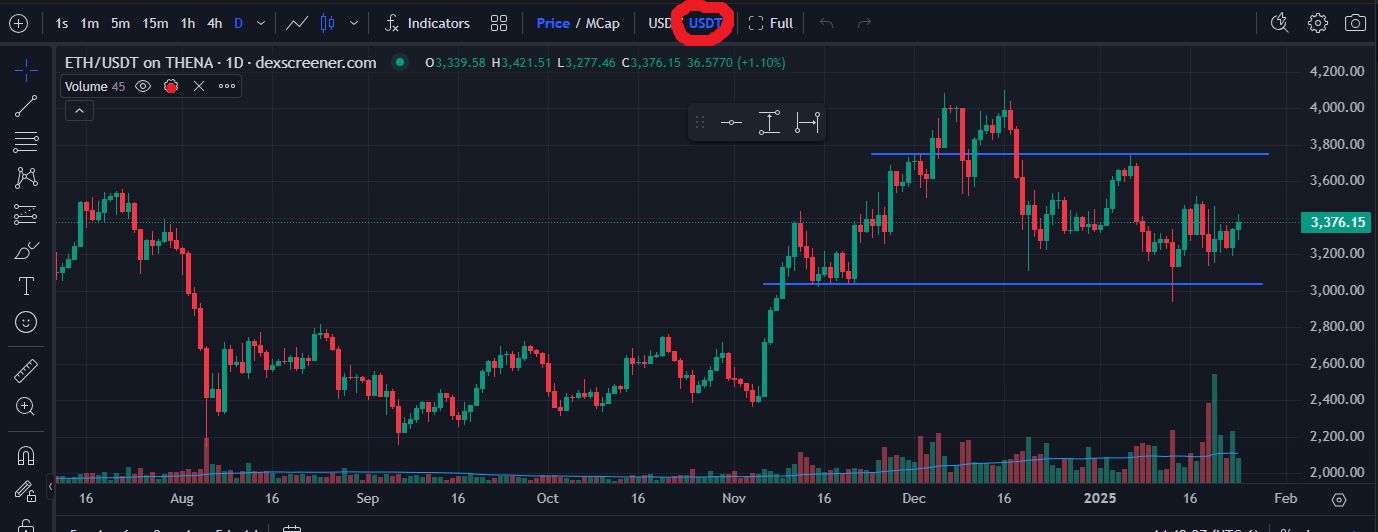
Setting up the 45-Day Volume Screening
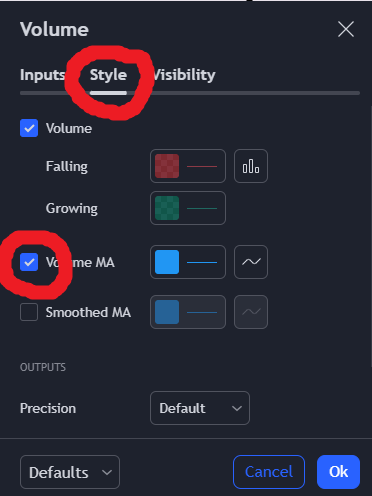
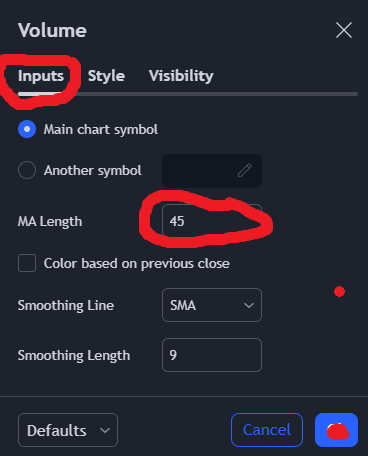
Getting The Results
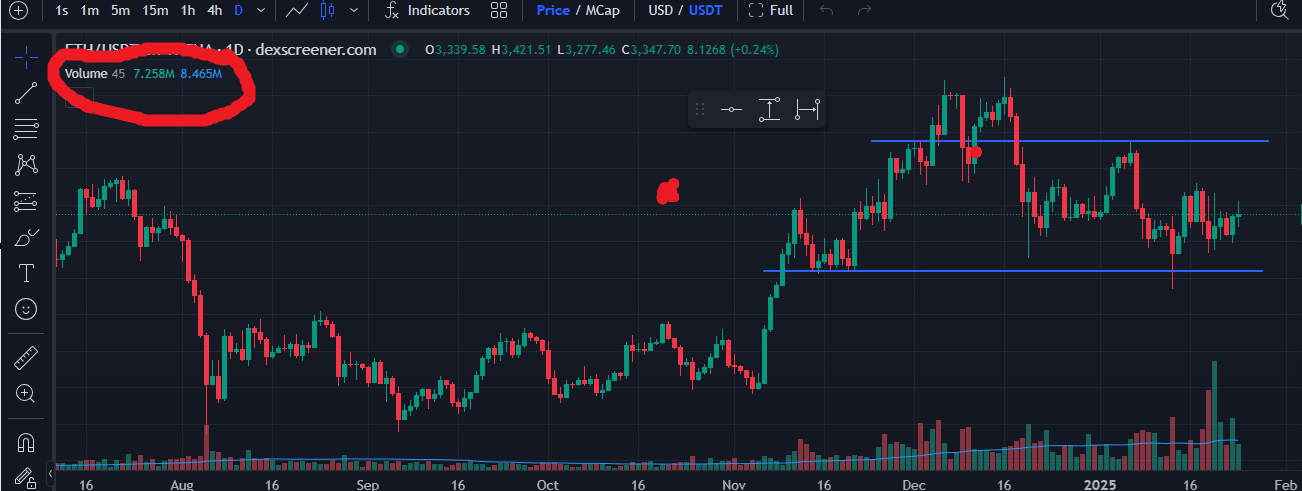
I recognize this was a bit tedious. Now, with patience, you can pull this stat on every pair you consider. The image below results from my attempt to validate the 24-hour volume listed with my initial screening.
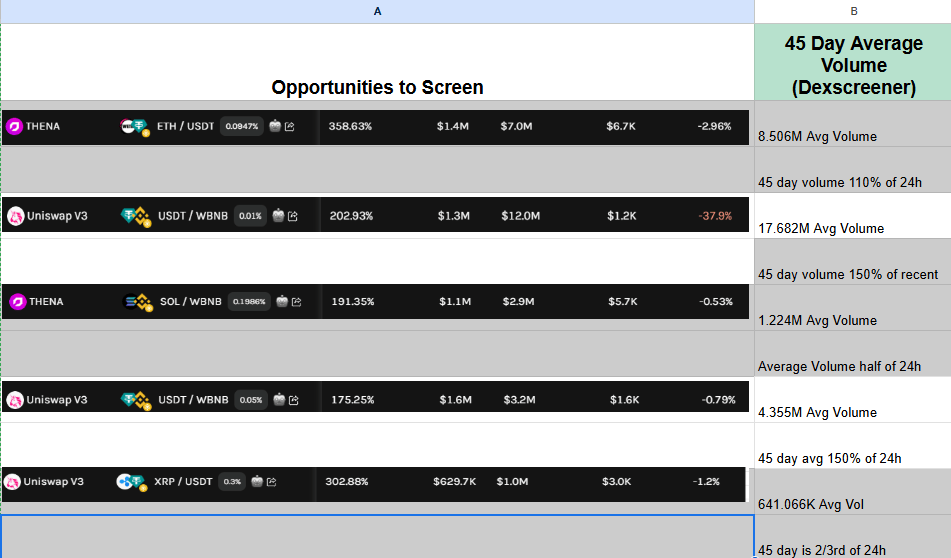
What I can and can’t tell from the results:
- If the 45-day volume is less than the 24-hour volume, then the 24-hour volume is a spike. It could mean the APR listed will be very short-lived.
- If the 45-day volume exceeds the 24h volume, the APR could be higher. As I learn, I ask, “Has the TVL gone down over the past 45 days, making the 45-day average less trustworthy?” This sounds like a question for the guru next week.
- Theoretically, the closer the 45-day average is to the 24-hour average, the better grade a particular opportunity should get. But, the more I think about it, the more “What if..?” scenarios develop.


Pingback: How to Determine What Crypto Pair to Buy: A Step-by-Step Guide - Algorithmic Trading 4UAlgorithmic Trading 4U